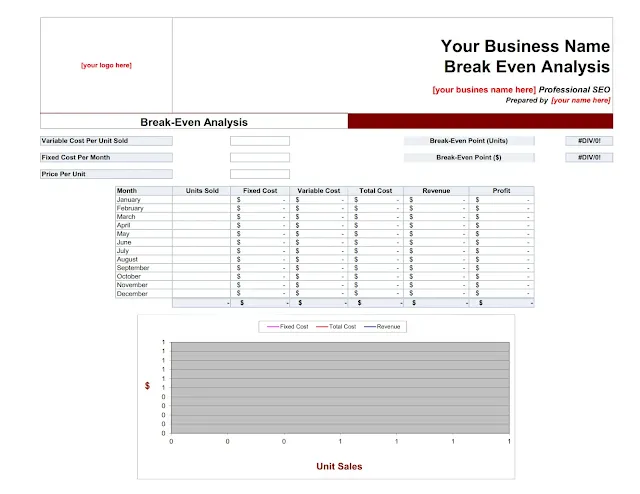
A Break-Even Analysis is a crucial financial tool that helps businesses determine the point at which total revenue equals total costs, meaning there’s neither profit nor loss. Understanding your break-even point can inform pricing strategies, cost management, and profitability forecasting. To facilitate this analysis, you can download and customize a Break-Even Analysis Excel template tailored to your business needs.
Understanding Break-Even Analysis
The Break-Even Analysis calculates the number of units a business needs to sell to cover its costs. It considers both fixed and variable costs and compares them with the price per unit to determine how many units must be sold to achieve a break-even point.
Key Components of Break-Even Analysis
Fixed Costs: Costs that do not vary with the level of production or sales, such as rent, salaries, and insurance.
Variable Costs: Costs that vary directly with the level of production, such as raw materials and direct labor.
Price Per Unit: The selling price of each unit of product or service.
Break-Even Point (Units): The number of units that must be sold to cover all fixed and variable costs.
Break-Even Point ($): The total revenue required to cover all fixed and variable costs.
Downloading the Break-Even Analysis Excel Template
The Break-Even Analysis template is designed to be user-friendly and customizable, allowing you to input your business-specific data and instantly calculate the break-even point.
Steps to Download and Customize the Template
Download the Template:
- Visit our website and navigate to the templates section.
- Select the "Break-Even Analysis Excel Template" and click on the download button.
Customize the Template:
- Open the downloaded Excel file.
- Replace placeholder text such as "[your business name here]" and "[your name here]" with your actual business details.
- Insert your company logo in the designated area for a professional touch.
Using the Break-Even Analysis Template
Once you have downloaded and customized the template, you can begin inputting your business’s financial data to calculate your break-even point.
1. Input Fixed Costs
- In the template, locate the "Fixed Cost Per Month" section.
- Enter your fixed costs, such as rent, salaries, utilities, etc.
2. Input Variable Costs
- In the "Variable Cost Per Unit Sold" section, input the cost that varies with production volume, like raw materials and direct labor.
3. Input Price Per Unit
- Enter the selling price for each unit of your product or service.
4. Calculate Break-Even Point
- The template automatically calculates the break-even point in both units and dollar amounts using the formula:
- Break-Even Point (Units):
Fixed Costs / (Price Per Unit - Variable Cost Per Unit) - Break-Even Point ($):
Break-Even Point (Units) x Price Per Unit
- Break-Even Point (Units):
Monthly Financial Summary
The template also includes a monthly financial summary section where you can track sales, costs, and profits throughout the year.
Month-by-Month Breakdown
- Units Sold: Enter the number of units sold each month.
- Fixed Costs: These will remain constant each month.
- Variable Costs: The template will calculate this based on the units sold.
- Total Costs: Sum of fixed and variable costs for each month.
- Revenue: Calculated by multiplying the number of units sold by the price per unit.
- Profit: Revenue minus total costs, indicating the profitability for each month.
Example of Monthly Financial Summary
Here’s how the financial summary might look once you’ve input your data:
January
- Units Sold: 1000
- Fixed Costs: $10,000
- Variable Costs: $5,000
- Total Costs: $15,000
- Revenue: $20,000
- Profit: $5,000
February
- Units Sold: 800
- Fixed Costs: $10,000
- Variable Costs: $4,000
- Total Costs: $14,000
- Revenue: $16,000
- Profit: $2,000
Interpreting the Results
Understanding the results of your Break-Even Analysis is crucial for making informed business decisions.
Key Insights:
- If your break-even point is higher than your current sales volume, you may need to either increase sales or reduce costs to become profitable.
- If your break-even point is lower than your current sales volume, you are operating profitably.
- Tracking monthly profits can help you identify trends and make strategic adjustments throughout the year.
Download and Customize a Break-Even Analysis Excel Template
Conclusion
A Break-Even Analysis is essential for understanding the financial dynamics of your business. By downloading and customizing our Excel template, you can quickly and accurately determine your break-even point, analyze monthly performance, and make informed decisions to enhance profitability.


