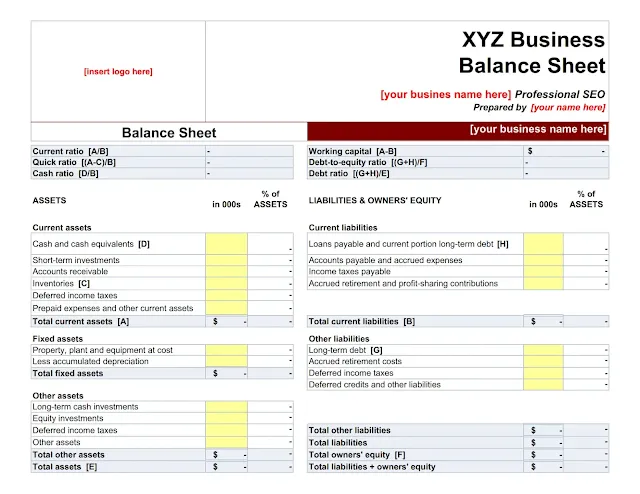
A classified balance sheet is a critical financial document that categorizes assets, liabilities, and equity into specific subcategories, providing a detailed view of a business's financial health. For small businesses, startups, and even large corporations, having a properly formatted classified balance sheet is essential for effective financial analysis and decision-making.
In this guide, we'll walk you through the process of downloading a sample classified balance sheet in Excel format, customizing it to your needs, and understanding the key financial ratios included in the template. Whether you’re a seasoned accountant or a small business owner, this guide will help you utilize a classified balance sheet effectively.
Understanding the Classified Balance Sheet
A classified balance sheet organizes assets, liabilities, and equity into subcategories, making it easier to analyze the financial position of a business. Here's a breakdown of the main sections typically found in a classified balance sheet:
- Assets: Includes current assets, fixed assets, and other assets.
- Liabilities: Includes current liabilities and other liabilities.
- Owners' Equity: Represents the residual interest in the assets after deducting liabilities.
The balance sheet provides a snapshot of the company’s financial condition at a specific point in time and is essential for calculating various financial ratios that indicate the company’s performance and stability.
Downloading a Sample Classified Balance Sheet in Excel
To assist businesses in preparing a classified balance sheet, we provide a downloadable sample template in Excel format. This template includes all the necessary fields and calculations, allowing you to customize it according to your business needs.
Steps to Download and Customize the Template
Download the Template:
- Visit our website and navigate to the downloads section.
- Select the "Sample Classified Balance Sheet in Excel" template and click on the download link.
Customize the Template:
- Open the downloaded Excel file.
- Insert your company’s logo in the designated area.
- Replace placeholders with your business name, such as "[your business name here]" and "[your name here]."
- Input your company's financial data into the corresponding cells.
Key Financial Ratios in the Classified Balance Sheet Template
The classified balance sheet template includes several key financial ratios that are automatically calculated based on the data you input. These ratios are essential for assessing your business’s financial health.
1. Current Ratio
- Formula:
[A/B] - Description: The current ratio measures your business's ability to pay off its short-term liabilities with its short-term assets. A higher ratio indicates better liquidity.
2. Working Capital
- Formula:
[A-B] - Description: Working capital is the difference between current assets and current liabilities. It represents the amount of capital available to fund day-to-day operations.
3. Quick Ratio
- Formula:
[(A-C)/B] - Description: The quick ratio, also known as the acid-test ratio, measures the ability to meet short-term obligations with the most liquid assets, excluding inventories.
4. Debt-to-Equity Ratio
- Formula:
[(G+H)/F] - Description: This ratio compares your total liabilities to your equity, indicating how much debt is used to finance the business. A lower ratio suggests a more financially stable company.
5. Cash Ratio
- Formula:
[D/B] - Description: The cash ratio measures your business's ability to pay off short-term liabilities with cash and cash equivalents alone, providing a stringent test of liquidity.
6. Debt Ratio
- Formula:
[(G+H)/E] - Description: The debt ratio shows the proportion of a company's assets that are financed by debt. It’s an important measure of financial leverage.
Breakdown of the Classified Balance Sheet Template
Assets
Current Assets: These include cash and cash equivalents, short-term investments, accounts receivable, inventories, prepaid expenses, and other current assets. The total of these assets is calculated in cell
[A].- Example:
- Cash and Cash Equivalents
[D] - Accounts Receivable
- Inventories
[C]
- Cash and Cash Equivalents
- Example:
Fixed Assets: This category includes long-term investments such as property, plant, and equipment (PPE), less accumulated depreciation. The total fixed assets value is calculated and displayed.
- Example:
- Property, Plant, and Equipment (PPE)
- Less: Accumulated Depreciation
- Example:
Other Assets: These include long-term cash investments, equity investments, and deferred income taxes, providing a comprehensive view of the company's non-current assets.
- Example:
- Long-Term Cash Investments
- Equity Investments
- Example:
Liabilities
Current Liabilities: This section includes loans payable, accounts payable, accrued expenses, income taxes payable, and any other short-term liabilities. The total current liabilities are shown in cell
[B].- Example:
- Loans Payable and Current Portion of Long-Term Debt
[H] - Accounts Payable and Accrued Expenses
- Loans Payable and Current Portion of Long-Term Debt
- Example:
Other Liabilities: Long-term obligations such as long-term debt
[G], accrued retirement costs, and deferred income taxes are included here.- Example:
- Long-Term Debt
[G] - Accrued Retirement Costs
- Long-Term Debt
- Example:
Owners' Equity
Owners’ Equity: The equity section includes the owner’s capital, retained earnings, and other components of equity. The total owners’ equity is displayed in cell
[F], representing the net worth of the business.- Example:
- Owner’s Capital
- Retained Earnings
- Example:
Total Assets and Liabilities
Total Assets: The sum of current assets, fixed assets, and other assets is displayed in cell
[E], providing the total value of the company’s assets.Total Liabilities and Owners’ Equity: The sum of liabilities and owners’ equity is calculated and displayed, ensuring the balance sheet balances, as total assets should equal total liabilities plus owners’ equity.
Download and Use a Sample Classified Balance Sheet in Excel
Download Now
Conclusion
Using a classified balance sheet template in Excel allows you to organize your business's financial information clearly and concisely. The template not only helps in tracking your financial position but also in calculating essential financial ratios that offer insights into the health of your business.


